Also, Christian Hauer suggested that we visualise the distance matrix using the heatmap packages. He suggested pheatmap, in particular. Thanks Christian.
I have spent some time creating two quite long scripts that generate a selection of visualisation of some gene expression data generated recently by Mel Boyd at the Cardiff CLL Research Group. The script illustrates a workflow that results in a selection of interesting and useful visualisations that allow us to compare the different drug treatments used.
The data was generated from an Affymetrix HTA 2.0 chip. The data has been normalised and mapped using the oligo package. I have focussed on the protein coding transcripts and I have generated a random selection of 5000 of these genes.
This part of the experiment uses the data from four different experimental 'drugs' which target different pathways and have different cellular effects. This analysis and the associated visualisations are used to allow us to compare the drug treatments and look at the data as a whole set.
I am happiest with the visualisation that is generated by the loadings of the principal component analysis but there are some other good visualisations generated by the scripts too.
The cluster at the top right is from the drug that causes the most changes. The other drugs cause few changes and so map closer to the untreated samples.
Next script shows volcano plots and a heatmap.
Here is the script:
# START
# download the data from github
library(RCurl)
x <- getURL("https://raw.githubusercontent.com/brennanpincardiff/RforBiochemists/master/data/microArrayData.tsv")
data <- read.table(text = x, header = TRUE, sep = "\t")
# basic commands for looking at the data
head(data) # view first six rows
str(data) # shows it's a dataframe
colnames(data) # column names
View(data) # this works in R-Studio
# for first part of analysis
# subset of the data with just the numbers.
new.data <- data[2:16]
# these are log2 values
# The data has been normalized
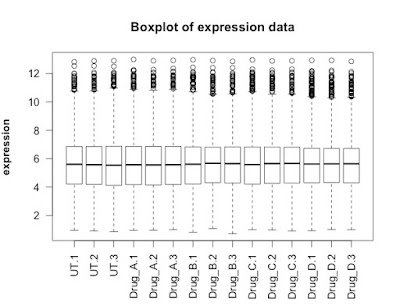
## FIRST visualisation of the data: a simple box plot
boxplot(new.data,
las =2, # las = 2 turns the text around to show sample names
ylab = expression(bold("expression")),
main="Boxplot of expression data")
## SECOND visualisation(s): calculate and visualise distances
# turn into a matrix
data.m <- as.matrix(new.data)
# transpose the data because a distance matrix works in rows
data.m.t <- t(data.m)
# calculate the distances and put the calculations into an object called distances
distances <- dist(data.m.t)
# convert this distances object into a matrix.
distances.m <- data.matrix(distances)
# you can look at this object.
View(distances.m)
# we can extract the size of the object and the titles
dim <- ncol(distances.m)
names <- row.names(distances.m)
# now to create the visualisation of the difference matrix.
# first the coloured boxes
image(1:dim, 1:dim, distances.m, axes = FALSE, xlab = "", ylab = "")
# now label the axis
axis(3, 1:dim, names, cex.axis = 0.8, las=3)
axis(2, 1:dim, names, cex.axis = 0.8, las=1)
# add the values of the differences
text(expand.grid(1:dim, 1:dim), sprintf("%0.1f", distances.m), cex=1)
# heatmaps ccan also be used to visualise the distance matrix.
# samples can be clustered or you can stop this. Thanks Christian Hauer
heatmap(distances.m)
heatmap3(distances.m)
pheatmap(distances.m)
plot(hclust(distances))
# three clusters - based on the distance matrix and shows the same thing really.
## FOURTH visualisation: principal component analysis
# Do a Principal Component Analysis
# and widely-used technique for viewing patterns of gross variation
# in datasets
# We can see whether an array is substantially different to the others
pca <- princomp(data.m) # function that does the PCA
summary(pca) # one component accounts for 99% of the variance
plot(pca, type = "l")
names <- factor(gsub("\\.\\d", "", names)) # change names into factor
plot(pca$loadings, col = names, pch = 19)
text(pca$loadings, cex = 0.7, label = colnames(new.data), pos =3)
# can be interesting to look at a subset of the data...
pca <- princomp(data.m[,1:12])
plot(pca$loadings, col = names, pch = 19,
main = "Just three drug treatments")
text(pca$loadings, cex = 0.7, label = colnames(new.data)[1:12], pos =3)
# basically happy with our data generally.
# next step in next script is to look at differentially expressed transcripts.


Hi Paul,
ReplyDeleteThanks for sharing your knowledge. I am wondering if I could find the script that has been used for the generation of these data ( per-processing, Normalization, deferentially expressed gene, etc. ). I am currently running some samples on Affymetrix HTA 2.0 chip and would like to know how to process them. I can figure out how to correctly set design and contrast matrices, since I don't have Treatment Vs Untreated group, I want all the samples beings compare against each other.
Thanks in advance.
best,
Hossein
Hi Hossein,
ReplyDeleteThanks for your message.
The packages and workflow are show in the script on this page:
http://rforbiochemists.blogspot.co.uk/p/a-script-to.html
Please give it a go. The downloading can be a little slow.
If it works, do say.
If not, please tell me and I will try to help further.
Best wishes,
Paul