During my
research, I have studied the
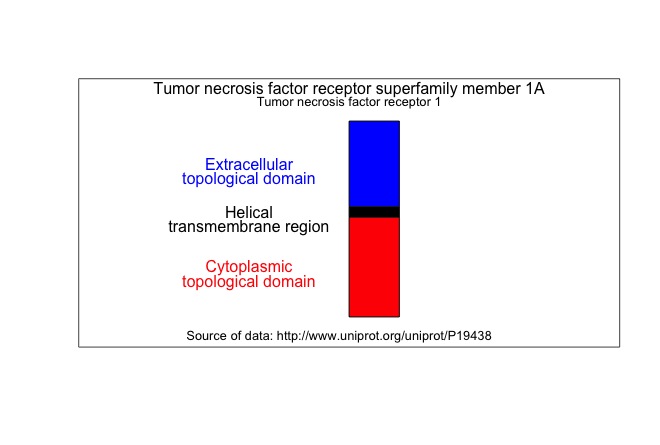
pro-inflammatory cytokine TNF and its
receptor, TNFR1. TNF and TNFR1 are involved in inflammatory diseases such as
rheumatoid arthritis. As part of developing my skills drawing molecules with R, I have written this script to draw TNFR1.
I like to draw receptors vertically with the thought that the
cell plasma membrane lies horizontal to the view. The height of the rectangles are proportional to the number of amino acids.
I took the data from the
UniProt page for TNFR1. Here is the diagram.
The key functions involved are the
- plot() function that creates the space to draw in
- rect() function that draws a rectangle
- text() function that adds text at a designated spot.
Here is the script:
# START
# draw the Tumor Necrosis Factor Receptor 1 with R.
# draw it as a series of rectanges
# vertically rather than horizontal.
# using the Uniprot webpage for the informaton
# http://www.uniprot.org/uniprot/P19438
# cut and paste from the XML page to create two objects
# first object is a list containing accession number and names
## Step 1: a list containing names
# list of names...
names <- list(
accession = c("P19438"),
name = "TNR1A_HUMAN",
protein.recommendedName.fullName = "Tumor necrosis factor receptor superfamily member 1A",
protein.recommendedName.alternativeName = "Tumor necrosis factor receptor 1",
protein.recommendedName.alternativeName.shortName = "TNF-RI",
gene.name.primary = "TNFRSF1A",
gene.name.synonym = "TNFAR",
organism.name.scientific = "Homo sapiens"
)
## Step 2: getting the details of the molecule
# draw TNFR....
# Topological domain 22 211 Extracellular 189
# Transmembrane 212 234 Helical 22
# Topological domain 235 455 Cytoplasmic 220
# create the data frame with all the information.
# cut and past from the XML page to make vectors
# features to plot
types <- c("chain", "topological domain", "transmembrane region", "topological domain")
description <- c("Tumor necrosis factor receptor superfamily member 1A, membrane form", "Extracellular", "Helical","Cytoplasmic")
begin <- c(22,22, 212, 235)
end <- c(455, 211, 234, 455)
subbegin <- 500 - begin # do these subtractions because we want to draw from top to bottom.
subend <- 500 - end
col <- c("white", "blue", "black", "red") # my decision - easy to change.
# assemble vectors into a data frame
features <- data.frame(types, description, subbegin, subend, col)
# check the structure of the data frame
str(features)
# shows description and col to be factors - this will cause problems later...
# so change them now
features$description <- as.character(features$description)
features$col <- as.character(features$col)
## step 3: draw the diagram - but vertically
screen.width <- 25
screen.height <- 550 # this is a bit arbitrary
# we create a plot space to draw in....
plot(c(0, screen.width),
c(0, screen.height),
type= "n",
xlab = "", xaxt = 'n', # suppress the x label and x axis
ylab = "", yaxt = 'n') # suppress the y label and y axis
# make the rectangles in a loop
for (i in 1:length(features$types) ) {
rect(xleft = screen.width/2,
ytop = features$subbegin[i],
ybottom = features$subend[i],
xright = screen.width/2+2.5,
col = features$col[i])
}
## Step 4: add text
# text positioning all for horizontal code
# add text to the top of the illustration with the recommended name
text(screen.width/2, screen.height-2.5, names$protein.recommendedName.fullName, cex=1)
# and the alternative name
text(screen.width/2, screen.height-30, names$protein.recommendedName.alternativeName, cex=0.8)
# and source
text(12, 3, "Source of data: http://www.uniprot.org/uniprot/P19438", cex=0.8)
# add the descriptions of the features and source
# "chain" doesn't really help as a piece of text so going to leave this out.
pos.text.y <- features$subbegin[2:4] + (features$subend[2:4] - features$subbegin[2:4])/2
pos.text.x <- 7.5
text(pos.text.x, pos.text.y, features$description[2:4], cex=1, col=features$col[2:4])
text(pos.text.x, pos.text.y - 35, features$types[2:4], cex=1, col=features$col[2:4])
## Step 5: add protein domains using shading as detailed on Uniprot
# add more TNF receptor domains:
begin <- c(43, 83, 126, 167, 356)
subbegin <- 500 - begin
end <- c(82, 125, 166, 196, 441)
subend <- 500 - end
description <- c("TNFR-Cys 1", "TNFR-Cys 2", "TNFR-Cys 3", "TNFR-Cys 4", "Death" )
types <- c("repeat", "repeat", "repeat", "repeat", "domain")
density <- c(10, 10, 10, 10, 5) # this gives lines in the shading
angle <- c(45, 135, 45, 135, 15) # this gives angles of the lines
features <- data.frame(types, description, subbegin, subend, density, angle)
features$description <- as.character(features$description)
# make the rectangles in a loop
for (i in 1:length(features$types) ) {
rect(xleft = screen.width/2,
ytop = features$subbegin[i],
ybottom = features$subend[i],
xright = screen.width/2+2.5,
lwd = 2,
density = features$density[i],
angle = features$angle[i]
)
}
# add the descriptions of the features
x <- length(features$types)
pos.text.y <- features$subbegin[1:x] + (features$subend[1:x] - features$subbegin[1:x])/2
pos.text.x <- 19.5
text(pos.text.x, pos.text.y, paste(features$description[1:x], features$types[1:x]), cex=1)
# SCRIPT END